What the Data Show About Police Killings of Black Men
A Review of Isabel Wilkerson's "Caste: The Origins of Our Discontents," Part 2 of 2
Book Review
WHAT THE DATA SHOW ABOUT POLICE KILLINGS OF BLACK MEN
A Review of Isabel Wilkerson's Caste, Part 2 of 2
Nandini Patwardhan
Editors’ note: This is the second part of a two-part analysis of some of the most striking claims Wilkerson makes in her 2020 book, Caste: The Origins of Our Discontents. We published the first part by the same reviewer last month.
Last month, JFBT published my analysis of two of the claims made by Isabel Wilkerson in her 2020 blockbuster book, Caste: The Origins of Our Discontents. In it I showed that the data do not support two claims made in the book, i.e., that (a) the number of hate groups increased significantly during the first term of the Obama administration and (b) that the proportion of the white vote won by the first black president was indicative of voters’ racism.
In this second part, I present my analysis of Wilkerson’s claims about the effects of police killings on black Americans. I show that references she cites in the book’s “Notes” section do not support her claims. I show that she used data selectively to draw alarmist inferences. Finally, I show that in (at least) one instance Wilkerson misunderstood the type of data she was dealing with, which again led to a highly charged interpretation.
Why does all this matter? I cite a study that illustrates the worrying extent to which the general public misunderstands the scale of police killings of black people (especially men and boys). To be sure, Caste alone is not responsible for the level of pessimism about this issue. However, given the book’s reach, it is undeniable that it is part of the chorus that contributes to the phenomenon.
Finally, since the goal of analyses of this type is advocacy to mitigate, and perhaps even eliminate, the problems that do exist, I note that Wilkerson offers no actionable solutions. For those, I draw attention to ideas advanced by some heterodox thinkers.
Let’s dive in.
All of the inferences I unpack are contained in a single paragraph that appears in a section of the book titled “Part Six: Backlash.”
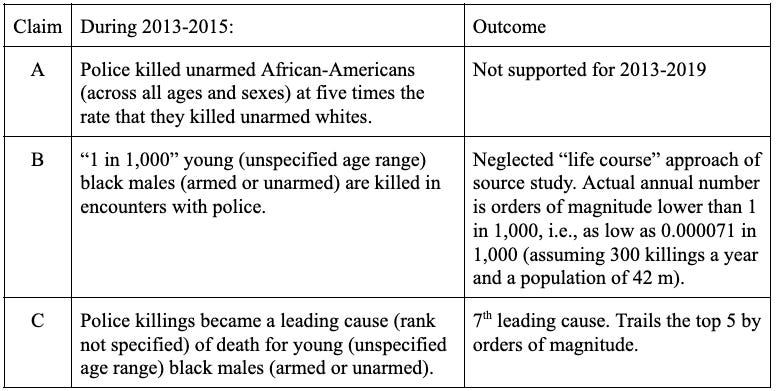
I found this to be one of the most sensational and obliquely phrased passages in the book. I had to read it several times just to untangle the threads and properly understand the statements. Since Wilkerson does not mention a range of years, but does mention the year 2015 and the second Obama term, I have to assume that she is referring to the years 2013-2015. Figure 2 offers an unrolling of the passage to make it more comprehensible:
Of the three statements, the “1 in 1,000” statistic (claim B) caught my eye for the massive scale that it represented. I felt compelled to examine the data with a view to developing a fuller understanding.
I first turned to the well-known and highly-respected Fatal Force police shootings database maintained by the Washington Post (together with US Census and CDC data). When none of the claims checked out there, I turned to the references cited in the “Notes” section of the book—the Mapping Police Violence website and a single Los Angeles Times article. Neither source validated Wilkerson’s claims. Below, I present my analysis of the three claims in Figure 2.
Claim A
During 2013-2015, police killed unarmed African-Americans (across all ages and sexes) at five times the rate that they killed unarmed whites.
Wilkerson cites, on page 434 of her book, a page on the Mapping Police Violence (MPV) website in support of this claim. That page is no longer available. Figure 3 presents a partial screenshot of the page as it was archived on 4/19/2017.
The good news is that the archived page confirms the 5X claim. However, upon digging deeper, the data in MPV’s own database fails to support its claim on its defunct webpage.
First, a few notes about the reliability and usability of MPV data. Even though the screenshot asserts that “police killed at least 102 unarmed black people in 2015,” the MPV Tableau tool shows the number to be 78. Also, the raw dataset is unwieldy. For example, it contains 47 different categories of “alleged weapons.” It would take tremendous effort to validate the assignment of these 47 categories to one of the four armed/unarmed statuses (“Allegedly Armed,” “Unarmed/Did Not Have Actual Weapon,” “Unclear”, and “Vehicle”) offered in the Tableau tool. For example, while “baseball bat” is coded as “Allegedly Armed,” “blunt object,” “screwdriver,” and “flagpole” are coded as “Unclear.” It is therefore not easy to use MPV’s raw data to perform an independent validation/analysis. With these caveats out of the way, let’s examine MPV data.
Figure 4 shows the numbers of unarmed black and white people killed by police during 2013-2019. It also shows the proportion of each per million and, in the rightmost column, the ratio of unarmed black to unarmed white people killed by police.
Notes:
Even though the screenshot from the archived MPV page backs up the 5X statistic that Wilkerson cites, the current data on the MPV website show that the proportion did not reach the 5X rate in 2015.
The proportion did not reach the 5X ratio in any subsequent or previous year.
The ratio was between 4 and 5 in 2014, 2015, and 2017.
The ratio was between 2 and 3 in 2016, 2018, and 2019.
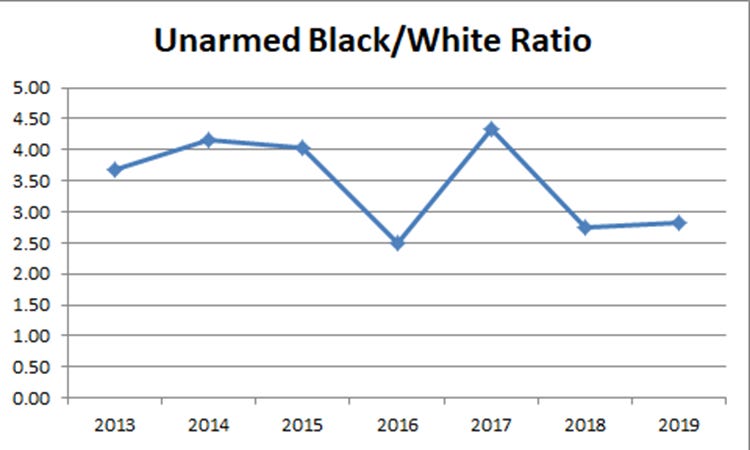
Figure 5 shows the trend line of the black-to-white ratio:
Notes:
There is no consistent year-over-year trend when it comes to the ratios of unarmed black and white people killed by police, apart from the fact that black people are killed at a consistently higher rate.
Police killings of unarmed individuals are undoubtedly egregious and merit special scrutiny. I became curious to figure out whether restricting the data to unarmed persons had any effect on the above observations.
I started by figuring out just how much of the data for black and white victims was being set aside by focusing on unarmed victims. Figure 6 represents the results:
Notes:
Unarmed black people constituted between 11% and 26% of the full dataset of black victims. In other words, close to 75% (or more) of the data about black victims was removed from consideration.
The actual numbers of deaths (pink highlighted columns), used for calculating ratios, ranged between 30 and 78 for black victims.
The proportion of unarmed black victims was significantly higher in 2014 and 2015.
The salience of these observations will become clear shortly.
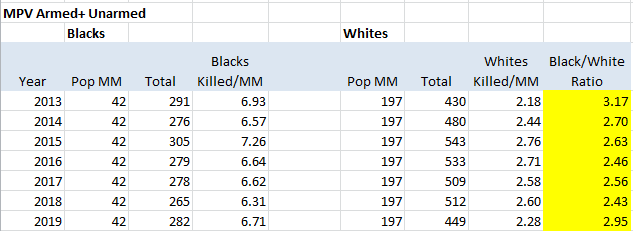
I then calculated the black-to-white ratio using the full dataset for each race.
Notes:
When the full dataset was used, the ratios of blacks to whites killed fell substantially. The ratio remained well under 3.5 and usually under 3.
Finally, we come to the salience of the data Wilkerson selected.
Risks inherent to focusing on ratios of small integers
Let's say that in a given year 20 black people (assume a population of 40 million) are killed by police, and 20 white people (assume a population of 200 million). Five times more blacks than whites are killed that year. Now consider a scenario in which 5 blacks and 4 whites are killed by police in a single year. The proportion jumps to 6.25. If the number of blacks killed is 8 and the number of whites killed remains 20, the proportion is still twice that of whites. An extreme hypothetical: if, in a given year, one black person and two white persons are killed, the black-to-white ratio is 2.5.
In short, focusing on ratios without a consideration of the overall numbers tends to lead to exaggerated estimates of the problem.
Data after 2015 was ignored even though the book was published in 2020
It is possible that Wilkerson grabbed the data in 2015 and got busy writing the book. By the time the manuscript was ready to be published, four years had passed and new data had become available. Did she simply forget to analyze the new data and make sure her inferences remained valid? Unfortunately, this explanation does not work. The references Wilkerson used to bolster the next two claims I examined were published in 2019. So, it is clear that she continued to seek new data well into 2019.
In short, Wilkerson chose to rely on and draw attention to 2015 data, which happened to be more in line with her preferred inference. And she ignored the data for subsequent years, possibly because it would have undermined that inference.
In summary, the claim that the police kill grossly disproportionately (5X) more unarmed blacks than whites is a glib and, I daresay, careless interpretation of the data.
Claim B
During 2013-2015, police killed “1 in 1,000” young (unspecified age range) black men and boys (armed or unarmed).
Wilkerson cites, on page 434 of her book, a single Los Angeles Times story in support of this claim. The lede of the story, which was published on August 16, 2019, reads as follows:
It is worth noting that the second sentence in the lede mentions a 2.5X ratio of black to white deaths at the hands of police. It includes both males and females across all ages and armed as well as unarmed encounters. So, it is not directly comparable to the 5X ratio we just analyzed which is about African Americans of every sex and age in unarmed encounters. Even so, the fact that Wilkerson completely ignored a relevant statistic in an article she cited is notable.
A few paragraphs in, the LA Times story cites a study by Frank Edwards and others at Rutgers University in support of the “1 in 1,000” figure. Finally, five paragraphs in, we come to a key point about the findings of the study.
The phrase “over the course of their lives” is the key to correctly understanding the results of the study. “Life course” results are the risks or odds of something happening over the course of a person’s entire life rather than the risks or odds of something happening to them in any given year. For example, the lifetime odds of dying from gun assault for a person born in 2019 were 1 in 289. But that does not mean that 1 in 289 people died (or had an odds of dying) from gun assault that year.
Wilkerson appears to have missed this point completely. She does not mention “life course” even once in relation to her “1 in 1,000” claim. Indeed, she does not even cite the research study in the “Notes” section. If she had referenced the original study, she would have found additional caveats for properly understanding its claims (there are, for example, 18 mentions of “life course” in the paper, which serve to make the concept clear).
Unfortunately, obfuscating or simply unaware of the life course approach of the study, Wilkerson’s words permit the reader to infer that police killed 1 out of every 1,000 young black men each year during 2013-2105.
To get a sense of the enormity of this claim, consider this: Using 2015 Census data, I estimate that the population of young (ages 14-34) black men is 6.5 million. “1 in 1,000” yields 6,500. Is it any surprise that a sizable proportion of Americans are feeling alarmed and cynical (data about this is presented later in this review) at the thought that about 6,500 young black men are being killed by police each year?
In Wilkerson’s defense, the LA Times story alludes to “life course” just once.
It is important to note that in this quotation Dr. Edwards does not mention "life course," which is a crucial bit of context for his findings. I would expect him to mention it each and every time he cites the "1-in-1,000" number, and to insist that those citing his study mention it, too.
In summary, it is troubling that the author of a book as important as Caste relied on the interpretation of one science reporter, who in turn relied on a misleading quotation from the study’s lead researcher. Wilkerson apparently did not seek direct clarification by consulting the study or its authors. Everyone in the chain—the study authors, the reporter, and Wilkerson herself—used selective presentation of the data in pursuit of attention-grabbing headlines.
Claim C
During 2013-2015, police killings were a leading cause (rank not specified) of death for young (unspecified age range) black males (armed or unarmed).
This claim is based on the LA Times story (and thus indirectly on the Rutgers study) discussed above. Due to the coupling of the two findings (“1 in 1,000” and “leading cause”) in both sources, it is far from obvious and is therefore important to note, that unlike the “1 in 1,000” statistic, the inference relating to leading cause is not based on “life course” metrics.
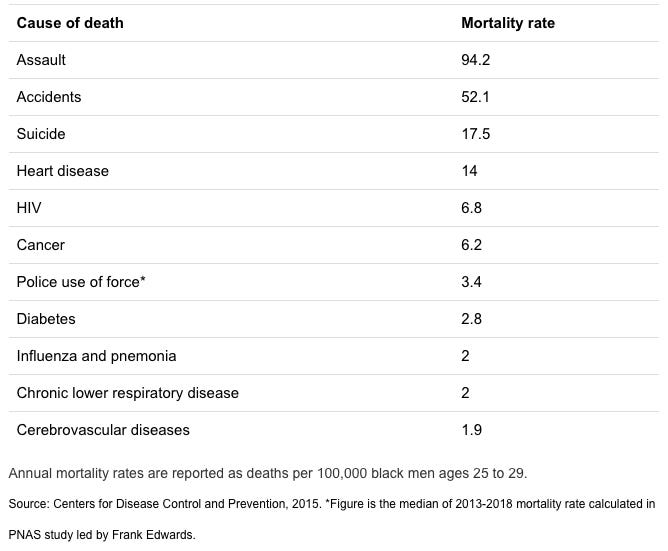
According to the LA Times story, for black men in the 25-29 age range, the 7th leading cause of death is “police use of force.” Figure 11 is a screenshot from the story:
Even if Wilkerson had looked at just this table, she would have noted that at 3.4%, this leading cause of death is half of the 5th leading cause (HIV at 6.8%), which itself trails the top four leading causes by orders of magnitude.
Looked at another way, the fact that police violence is the 7th leading cause of death for men in the 25-29 age range is not particularly surprising. For starters, men in that age range have naturally low mortality rates—unlike older people, they are in the prime of their health. Second, when they do die, it is rarely of natural causes or disease. And, this is the age group—for all races—that is among the most likely to engage in behavior that results in encounters with the police.
In summary, it is fair to conclude that police violence as a “leading cause” of death for young black men is far less meaningful than appears at a first reading of Wilkerson’s Caste. Nevertheless, it is crucial to acknowledge that no matter how the numbers are run, there's just no getting away from the fact that black people are killed at about 2.5 times the rate of white people. Even if Wilkerson is deceptive in her presentation of numbers, this raw fact remains inescapable...and horrifying. Any number of explanations have been put forth for this disparity, from higher rates of offending, to higher rates of poverty, to systemic racism. We prefer to recommend a solution that would cover all these possible causes, in the final section, below.
Summary
Readers will recall my initial unrolling of Wilkerson’s loaded passage in Figure 2. I have summarized the outcome of my analyses in Figure 12:
Conclusion: Why does this matter? What is the significance of these findings?
Isabel Wilkerson’s Caste is a highly acclaimed book. Besides being selected by Oprah’s Book Club, it received accolades from the New York Times, LA Times, Bloomberg, Christian Science Monitor, and Publishers Weekly. In addition, it was on the National Book Award Longlist and was a finalist for the National Book Critics Circle Award. The book has over 33,000 ratings and an almost 5-star average on Amazon.com. In short, the book has had tremendous reach and wide impact.
So, it is disappointing that the five claims (two of them in Part 1) that I investigated did not check out. Worse, these flawed claims have been accepted unquestioningly by a wide range of media, intellectuals, and lay readers. The book thus contributes to a highly skewed but dominant narrative about the prevalence of racism in contemporary American society.
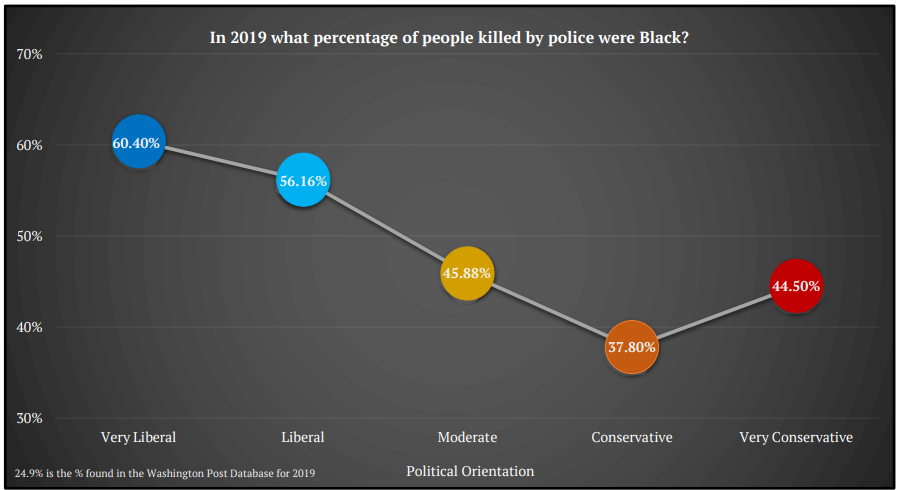
Skewed narratives have consequences. For example, according to a research report from the Civil Unrest and Presidential Election Study (CUPES), the popular understanding of the scope of the problem of police killings of black people is out of proportion to reality, as shown in Figure 13.
Estimates of the percentage of people killed by police who are black range from 37.8% (Conservatives) to 60.4% (Very Liberal). In reality, about 25% of people killed by police are black.
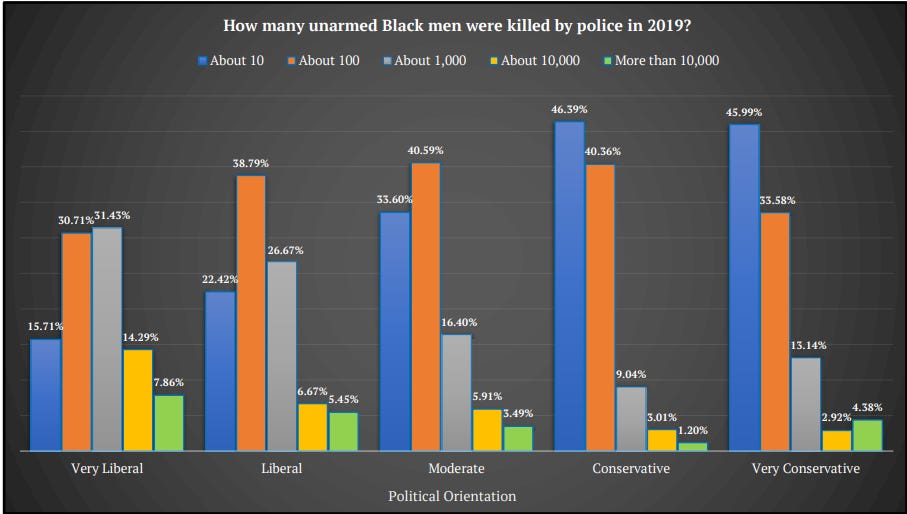
Moreover, when asked to estimate how many unarmed black men were killed by police in 2019, over 31% of “very liberal” people estimated that the police killed “about 1,000,” and 22% put the number at or over 10,000. Of those who are merely “liberal,” almost 27% think the police killed “about 1,000” and more than 12% think it was in the vicinity of 10,000 or more. Figure 14 breaks it down:
The actual number is 11 according to the Washington Post Fatal Force database; and it is 32 (both men and women; the tool does not allow filtering by gender) according to the Mapping Police Violence database. Thus, members of Caste’s target audience—those who identify as “liberal” and “very liberal”—are the ones who are, unsurprisingly, the most misled.
The scale of misunderstanding is troubling for a number of reasons. Apart from the fact that the truth is compromised, the effect is bitter political polarization and social mistrust. There are problems with police violence against black people (and not only against black people). However, the analysis presented here (and elsewhere, such as here and here and in resources available here) suggests that present day problems with policing do not justify the alarmism that has become the dominant narrative.
The Boy Who Cried Wolf
This alarmism, unsupported as it is by facts, runs the risk portrayed in Aesop’s fable about the boy who cried wolf, i.e., the risk of turning away the very people who might otherwise be inclined to be, or be persuaded to become, allies in crafting sensible and effective reform.
I offer myself as an example of this risk. Before I came to the US in the early 1980s, I had assumed that the little I knew about slavery and its legacy was of the distant past. This was in line with my experience growing up in an India that had been independent for approximately two decades. It was clear to the young me that British rule was in the country’s rear-view mirror; all around me families, communities, and the larger society were all focused on progress and human development. We simply did not dwell on the wounds of a bygone era.
Against this background, living in the US and gradually awakening to the shadow that the history of race casts in the present was a disorienting, even heartbreaking, experience. Educating myself about US history has been a chosen project of mine for the last four decades. I have both volunteered for and donated to charities that support my fellow black Americans.
And so, I find it quite astonishing that circumstances compelled me to undertake this deep dive into the claims made in Caste and to devote countless hours to writing this analysis. I am still the same person, one who believes in human progress, equality, and fairness. However, the center has shifted and I find myself in the uncomfortable position of a skeptic, albeit one who is committed to remaining open-minded and sympathetic.
Back to the 1880s?
Wilkerson’s Caste is replete with many additional data-based claims. It is to be hoped that a great many of them (if not all) are accurate and adequately contextualized. However, it would require tremendous effort and time to validate them all. And, to be frank, I now have doubts about Wilkerson’s bona fides as a trustworthy chronicler. Her own words affirm that in her view, the current state of affairs is as bad as during the 1880s.
Wilkerson plants the seeds of defeatism, cynicism, and anger when she expresses her belief that the US has not made any progress in race relations since the decades immediately following the Civil War. I wish I could ask her if a woman like her could have—during the 1880s—reached the highest pinnacle of journalism and recognition that she has. And, whether a black man could have become mayor of a town, let alone have been elected president twice.
To be clear, I do not wish to suggest that it is improper to be concerned about issues such as racism in voting patterns, hate groups, or police killings. What I care about is that diligent and good faith attempts be made to arrive at the most accurate possible understanding of the scale and nature of the problem. The urgent need is to craft targeted and effective remedies/solutions. If we misdiagnose the problem, we will surely misdirect the solution.
Solutions?
At this point it is crucial to acknowledge that, Wilkerson's misleading presentation notwithstanding, there is broad consensus among a range of sources about the fact that black Americans are killed at about 2.5 times the rate of their white counterparts. A number of explanations have been put forth for this disparity, from higher rates of offending to systemic racism. As an American, I find this disparity shameful and it spurs me to search for solutions.
It is worth noting that Caste has almost nothing to say about the effect on the black community of the war on drugs or of lack of access to high quality education and jobs. Indeed, in the book’s epilogue, by way of solutions, Wilkerson invokes ideas such as “radical empathy,” “responsibility,” and “moral duty”—for members of the “dominant caste.” I do not wish to suggest that these attitudinal changes and commitments are unimportant. Rather, I wish to note that it is vital that they be matched by actionable policy proposals. Unfortunately, Wilkerson does not advance a single such proposal.
John McWhorter suggested in a recent podcast interview (starting at about the 54 minute mark) that ending the war on drugs will do more, more directly, and within a generation to change the current dynamic. According to him, when the possibility of making a living in the drug trade is eliminated, poor young black men will more willingly steer towards alternate avenues of making a living—learning a trade and earning a wage that can support a family. Needless to say, decriminalization of drugs would dramatically decrease high-stakes interactions between young black men (indeed, all young men) and police. The stick of law enforcement will thus be replaced by the carrot of opportunity and life success brought within reach. By not offering such actionable solution ideas, Wilkerson fails to make room for black people’s own agency.
I confess that I am neither trained nor employed in any relevant academic discipline. Even so, inspired by my interactions with a black mentee in a Life Skills program, I published an audacious article titled “A Marshall Plan for Black Lives.” The story of one life told thoughtfully, even though it constitutes a sample of one, can illuminate issues and personalize them in ways that reams of data may not.
Every American, regardless of race, deserves the opportunity to lead a life of abundance, not just of material goods, but also of agency and dignity. If we are to achieve this American Dream, we must start by taking stock—acknowledging the real progress that has been made and that continues to be made. Next, we must resolve to use statistics with integrity, to critically analyze—and when necessary, challenge—inferences and their underlying data. Finally, as one of the richest countries in the world, we must use the considerable resources at our disposal to design and implement bold solutions.
And thus, we shall overcome!
Nandini Patwardhan is originally from India but has now lived in the US for four decades. She is a retired software engineer and a passionate nonfiction writer, whose work was awarded the San Francisco Press Club Award in 2020 and 2021. Her 2020 biography of Anandi Joshee (1865–1887), titled Radical Spirits: India's First Woman Doctor and Her American Champions, won the Benjamin Franklin Award in Biography. Nandini lives in Oakland, CA. Follow her on Twitter and visit her website.









Thank you for this analysis, Nandini! I agree that a 2.5x disparity is troubling enough, and that exaggerating the scale of the problem makes it harder, not easier to address. I did a similar analysis of the Rutgers study last year on my blog: https://postwoke.substack.com/p/on-fear What worries me most is the feedback loop such exaggerations create. Celebrities like Chelsea Handler tweet “why would any person of color ever comply with a police officer when there is a 50/50 shot of getting ‘accidentally’ shot,” a tweet she sent on 4/13/21 that is still up. This kind of thinking INCREASES the likelihood of death at the hands of cops. Wilkerson may be right that radical empathy is needed, but it really needs to happen in both directions to improve understanding, reduce fear, build trust and improve lives.
Great. Thank You.